Introduction
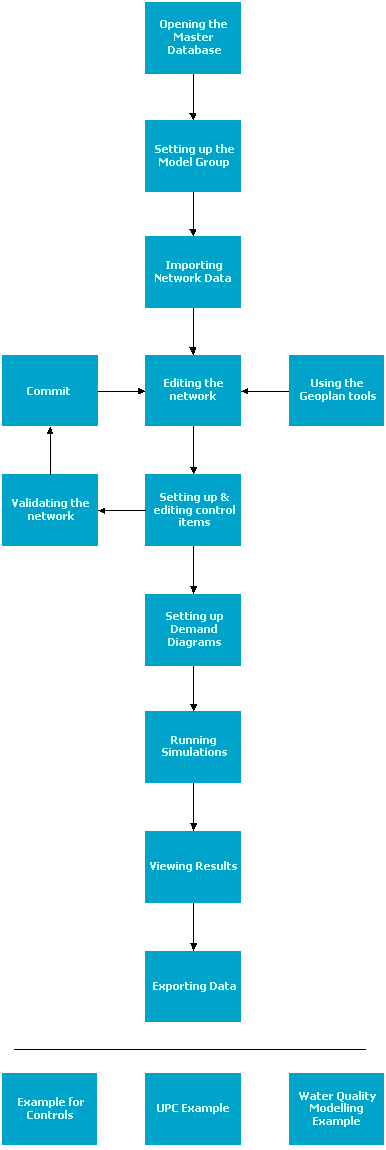
The flowchart below describes the main steps for running a simulation in InfoWorks WS Pro.
Before entering this part of the tutorial, you may want to browse the glossary.
Click a rectangle to open a page containing more details on the desired step.

 Tip
Tip The image above is clickable, i.e. the cursor will change into a hand when a clickable area of the image is hovered over. Click a rectangle to reveal the related topic. Non-clickable rectangles have a different colour.